The technical CRI report was prepared by the
CIE (Commission Internationale de l'Eclairage) Division 1 Vision and Colour.
Calculating CRI
u = 4X/(X + 15Y + 3Z) (1-1a)
v = 6Y/(X + 15Y + 3Z) (1-1b)
To account for the adaptive color shift due to the different state of chromatic adaptation under the lamp to be tested, k, and under the reference illuminant, r, use the following formula:

(1-2)

The values u'k,i and v'k,i are the chromaticity coordinates of a test color sample, i, after the adaptive color shift, obtained by moving the light source to be tested to the reference illuminant, i.e. u'k = ur v'k = vr and should not be mixed up with CIE 1976 u', v' coordinates.
The functions c and d for use in equation (1-2) shall be calculated for the light source to be tested uk,vk, and the test color samples i under the light source to be tested uk,i, vk,i according to the following:
c = (4 - u - 10v)/v
(1-3)
d = (1.708v + 0.404 - 1.481u)/v
Color imetric data must now be transformed into the 1964 Uniform Space coordinates by the following:


The values u'k = ur, v'k = vr are the chromaticity coordinates of the light source to be tested after consideration of the adaptive color shift. The values Yr,i and Yk,i must be normalized so thatYr = Yk = 100.
One must calculate the difference between the resultant color shift of the test color sample under the test lamp k and illuminated by the reference r. The following 1964 Colour Difference Formula should be used:
![]() (1-5)
(1-5)
Calculate the Special Color Rendering Index, Ri, for each test color sample by the following:
Ri = 100 - 4.6DEi (1-6)
Calculate the general Color Rendering Index, CRI, by the following:
![]() (1-7)
(1-7)
The calculation uses 8 test color samples typically.
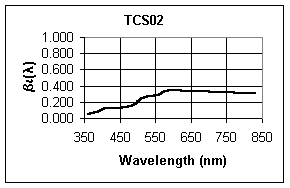
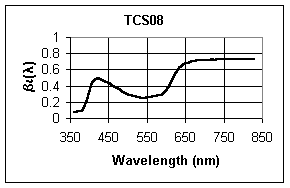
CIE test color samples:
Approximate
Munsell Notation Colour appearance under daylight 1 7,5 R 6/4 Light greyish red 2 5 Y 6/4 Dark greyish yellow 3 5 GY 6/8 Strong yellow green 4 2,5 G 6/6 Moderate yellowish green 5 10 BG 6/4 Light bluish green 6 5 PB 6/8 Light blue 72,5 P 6/8 Light violet 8 10 P 6/8 Light reddish purple 9 4,5 R 4/13 Strong red 10 5 Y 8/10 Strong yellow 11 4,5 G 5/8Strong green 12 3 PB 3/11 Strong blue 13 5 YR 8/4 Light yellowish pink (human complexion) 14 5 GY 4/4 Moderate olive green (leaf green)


Contact: Eason Wang
Phone: +86-13751010017
E-mail: info@iec-equipment.com
Add: 1F Junfeng Building, Gongle, Xixiang, Baoan District, Shenzhen, Guangdong, China